
2 effective data and graphing assessments for 1st grade
I’ve been blogging the last few weeks about creating data displays with kids and learning to collect data! So now, let’s talk about some effective data and graphing assessments to help see what kids have learned about data collection and graphing! After all, we can’t know what kids know unless we ask them to show and tell us!

Formative Graphing Assessments: Cut, Count & Graph
I wanted to make sure my first grade kiddos really understood the attributes of a data display chart from earlier in the week. So, I gave them this “cut, count and graph” activity from my Spring 1st grade Graphing Packet. They worked on it independently, but not in a testing environment…they were sitting with their groups and were allowed to talk to each other.
While this is an “activity” in my 1st grade graphing packet, I used it as a formative assessment to see how much growth we’d made with our understanding of data. No, this graphing activity is not as “from scratch” or authentic as our collaborative displays from day one. But I felt it was appropriate for our independent practice to give them some scaffolds….like the category labels and starting points.
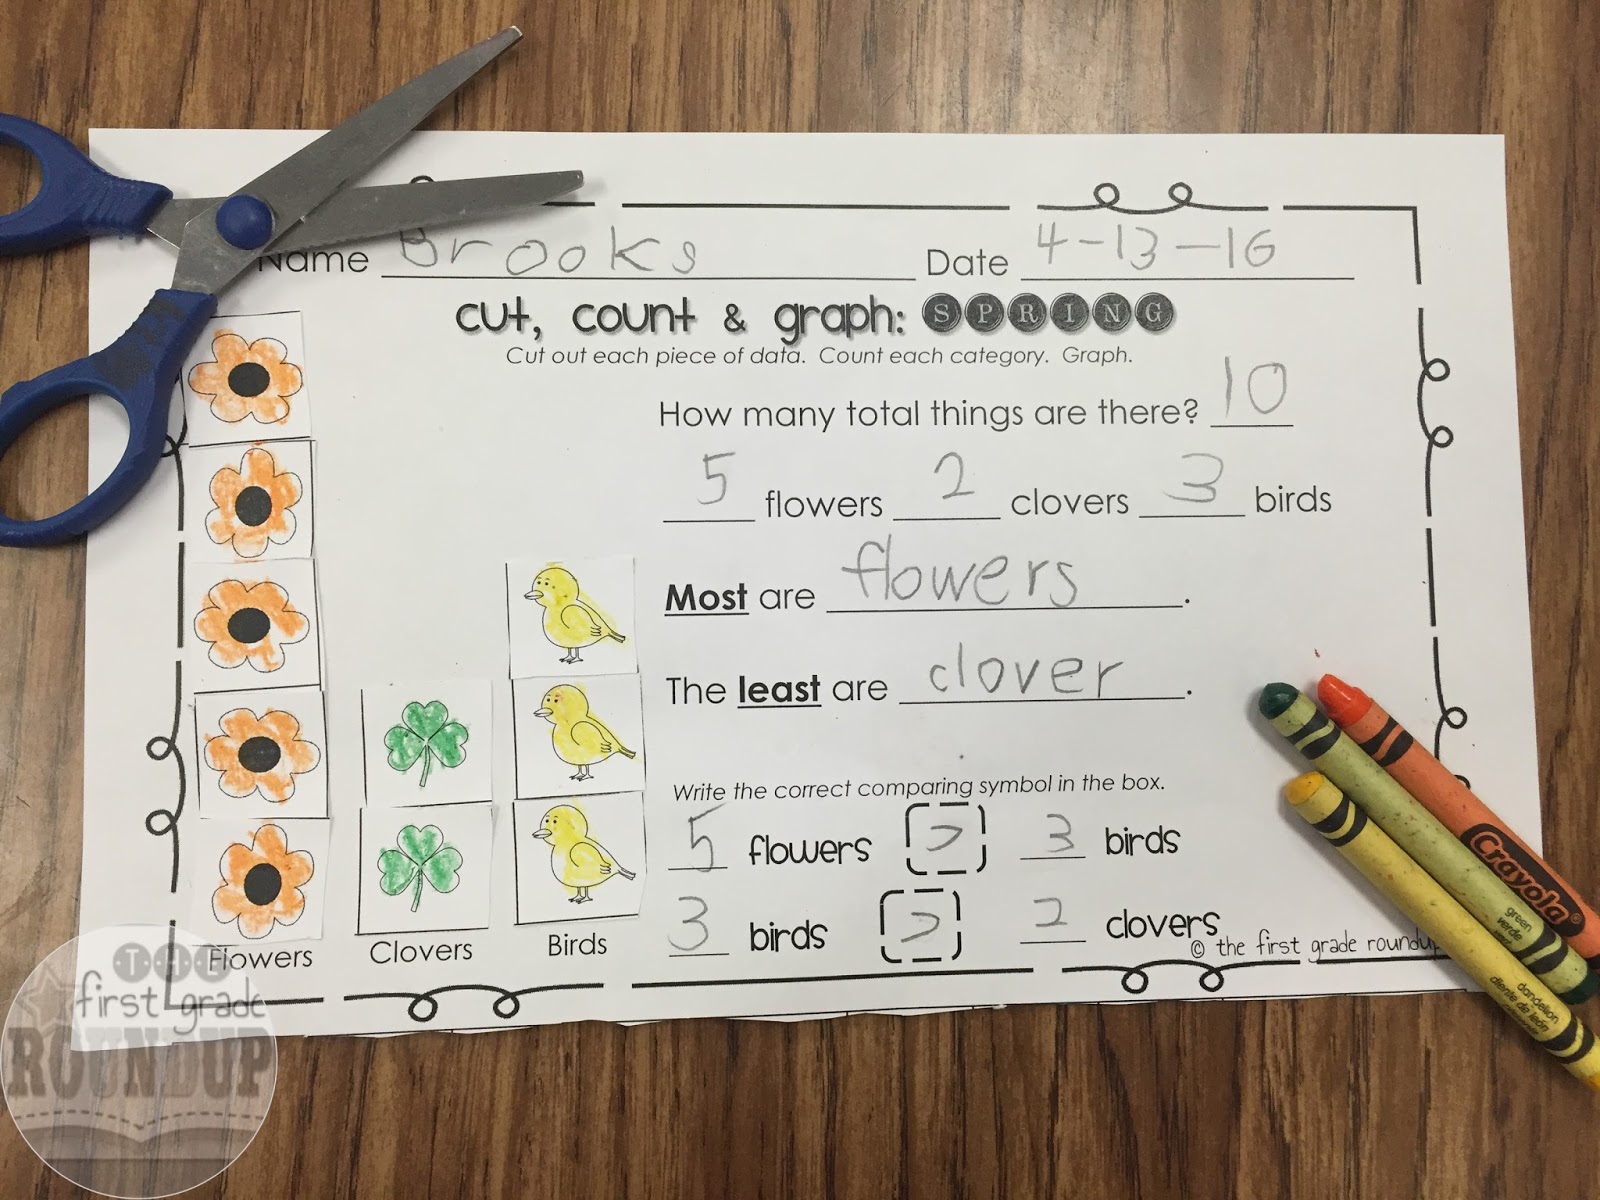
After they finished, I collected all of the papers and we put each one on our document screen and assessed them based on our anchor chart we were using as a data display checklist. And I was floored with how far my firsties had come from day 1 of building graphs. I said it in that first blog, but I think it’s worth repeating. This growth and understanding would’ve NEVER happened if the only data experiences my kids had were coloring in pre-made graphs. They wouldn’t have had to deal with the problems of starting point, gaps, overlaps, labels….
Summative Assessment for 1st Grade Graphing
At the end of our 1st grade graphing unit, I did a summative assessment from my year long math assessment packet. They counted and graphed the animals in my pre-made data display. In this assessment, I was really more focused on the data analysis part of our standards, so coloring in a premade graph was fine. In fact, by making that part “easy,” it gave kids more mental space to focus on the data analysis.

Where Can I Find These Graphing Assessments & Activities?
You can find this assessment and many, many more {at least one for each first grade math standard, plus quarterly math assessments} in my 1st grade math assessments packet!

And don’t forget to grab my Spring Graphing Packet for all of the graphing fun I’ve been blogging about plus much, much more! Or download the graphing bundle for year long experiences with data displays!
