5 simple steps to analyzing Data for Kids in First Grade
Analyzing data for kids is an important life skill… and learning how to analyze data can and should start as early as kindergarten. I use the 5 C’s of data to help kids learn the process of analyzing data: Create, Collect, Count, Compare, and Communicate. Let’s take a closer look at each of these steps and what it looks like in the first and second grade classroom.

analyzing Data Anchor Chart
During our 2nd grade math block last year, we talked about analyzing data using the 5 Cs: Create, Collect, Count, Compare, and Communicate. This is just a helpful guide to help kids understand the process of analyzing data. Sometimes we do all of those. Sometimes, we skip to comparing data that’s already been created, collected and counted for us. But all of these are important steps that even adults go through to analyze data.
When we talked about this in 2nd grade math, we made the connection to my husband’s job. He does data analysis all day every day for Walmart. And many people depend on his analyses to be correct so that they right amount of the right things get on the shelves! 🙂 (no pressure, right??) So, data analysis is a life-long skill that we use as adults.
Here’s a look at what our anchor chart looks like. (Find this analyzing data anchor chart here.)

create & Collect the Data
Before we start analyzing data for kids, we need to create our data plan. What are we going to analyze? What do we want to know? Would you rather questions are perfect for this in kindergarten or first grade. Or asking kids which thing they like better… hot chocolate or apple cider? Or pumpkin or apple pie?
Then, collecting data can be as simple as asking “Would you rather?” questions and tallying answers as a class, or even roll and record data games! For group or independent work, I love having hands on tools to help them collect the data. For an easy center, have a grab bag of multi-colored manipulatives like unifix cubes or diecuts of a seasonal theme (different colored apples) in a bag.
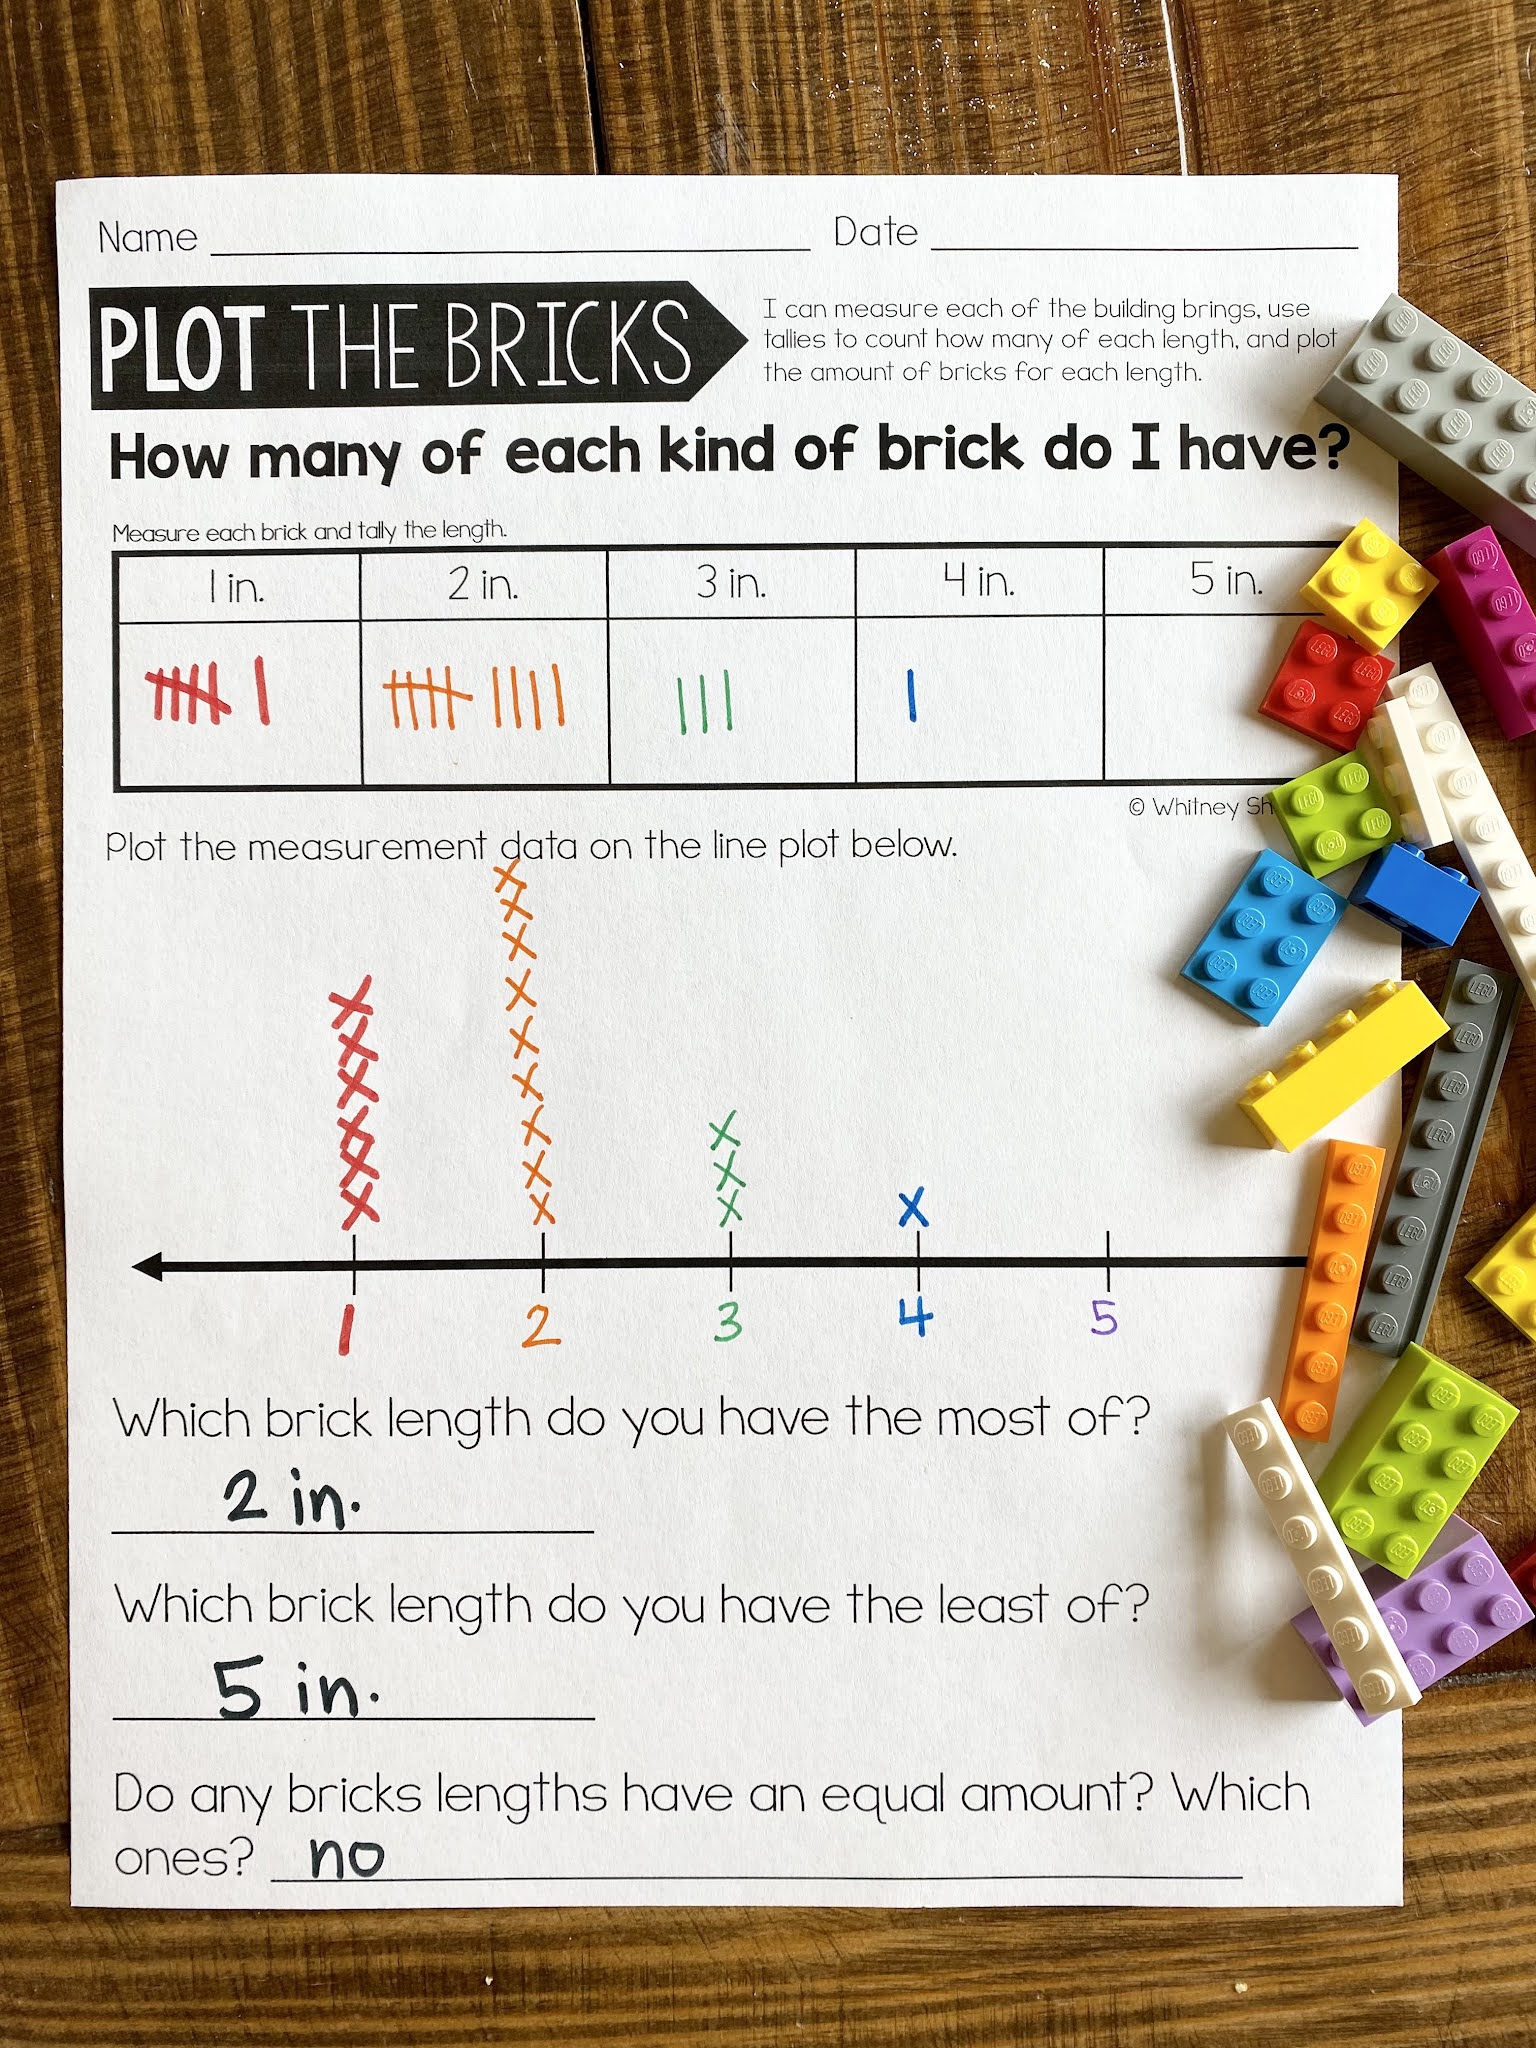
With my 2nd grader last year, we used legos because he’s obsessed with lego building right now.
He grabbed a handful of legos, measured them and tallied the results!
Count & Compare the Data
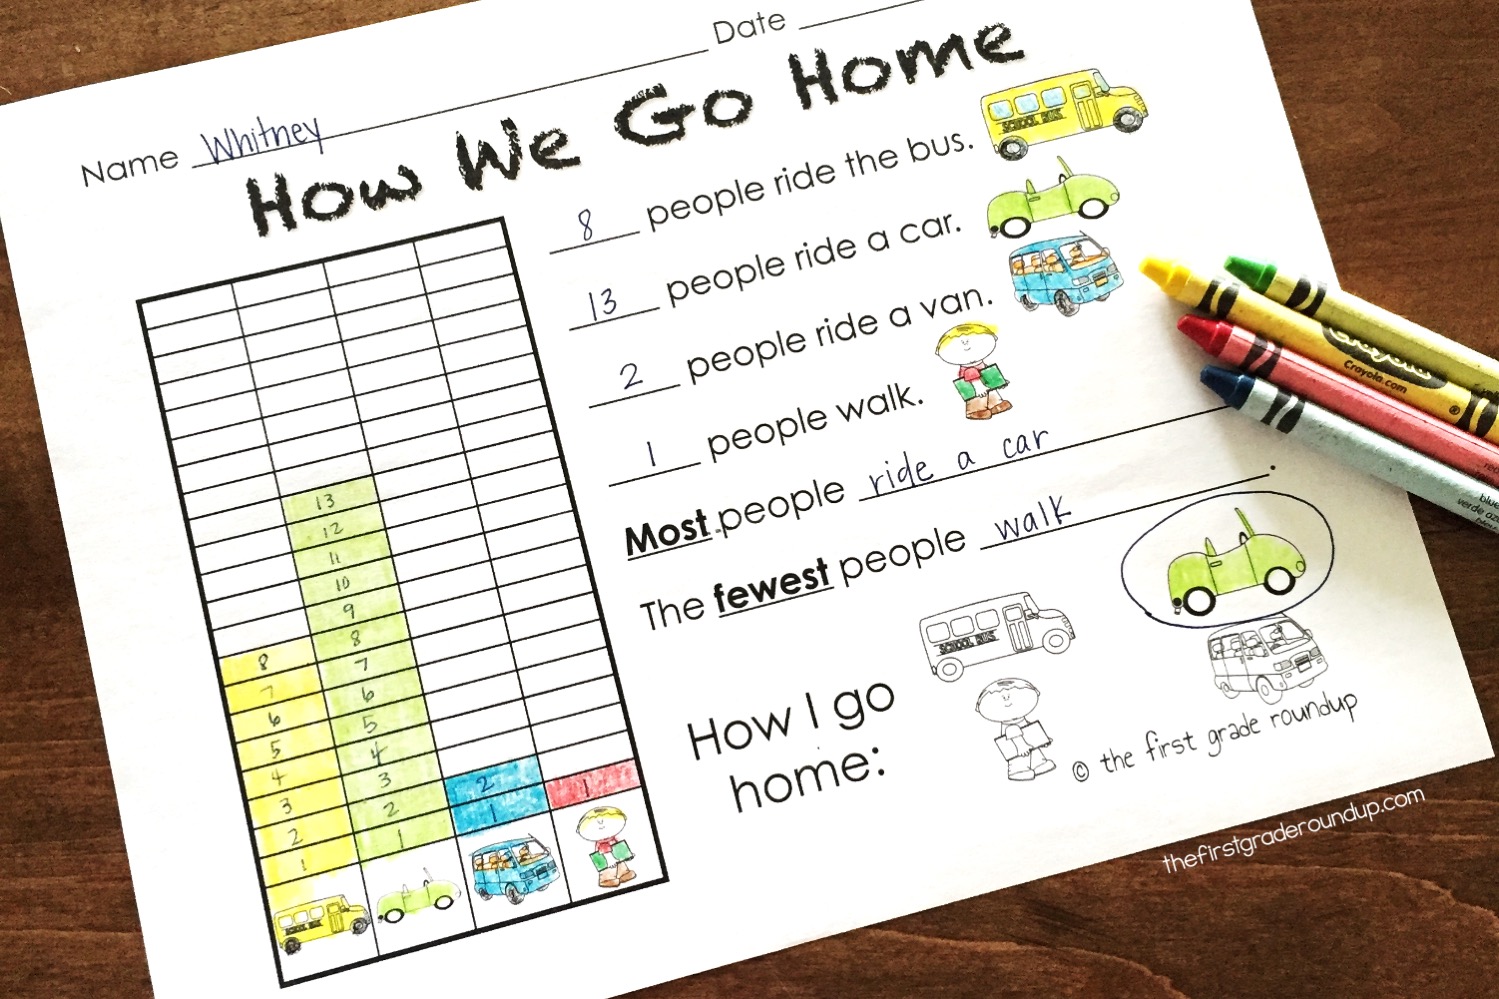
After the data has been collected, the next part of analyzing data for kids is counting and comparing the data. When we first work on this, I give the kids the “collected data” so that they can just focus on counting and comparing. Here’s a peek at a graph I’ve used in kindergarten and first grade on the first day of school.
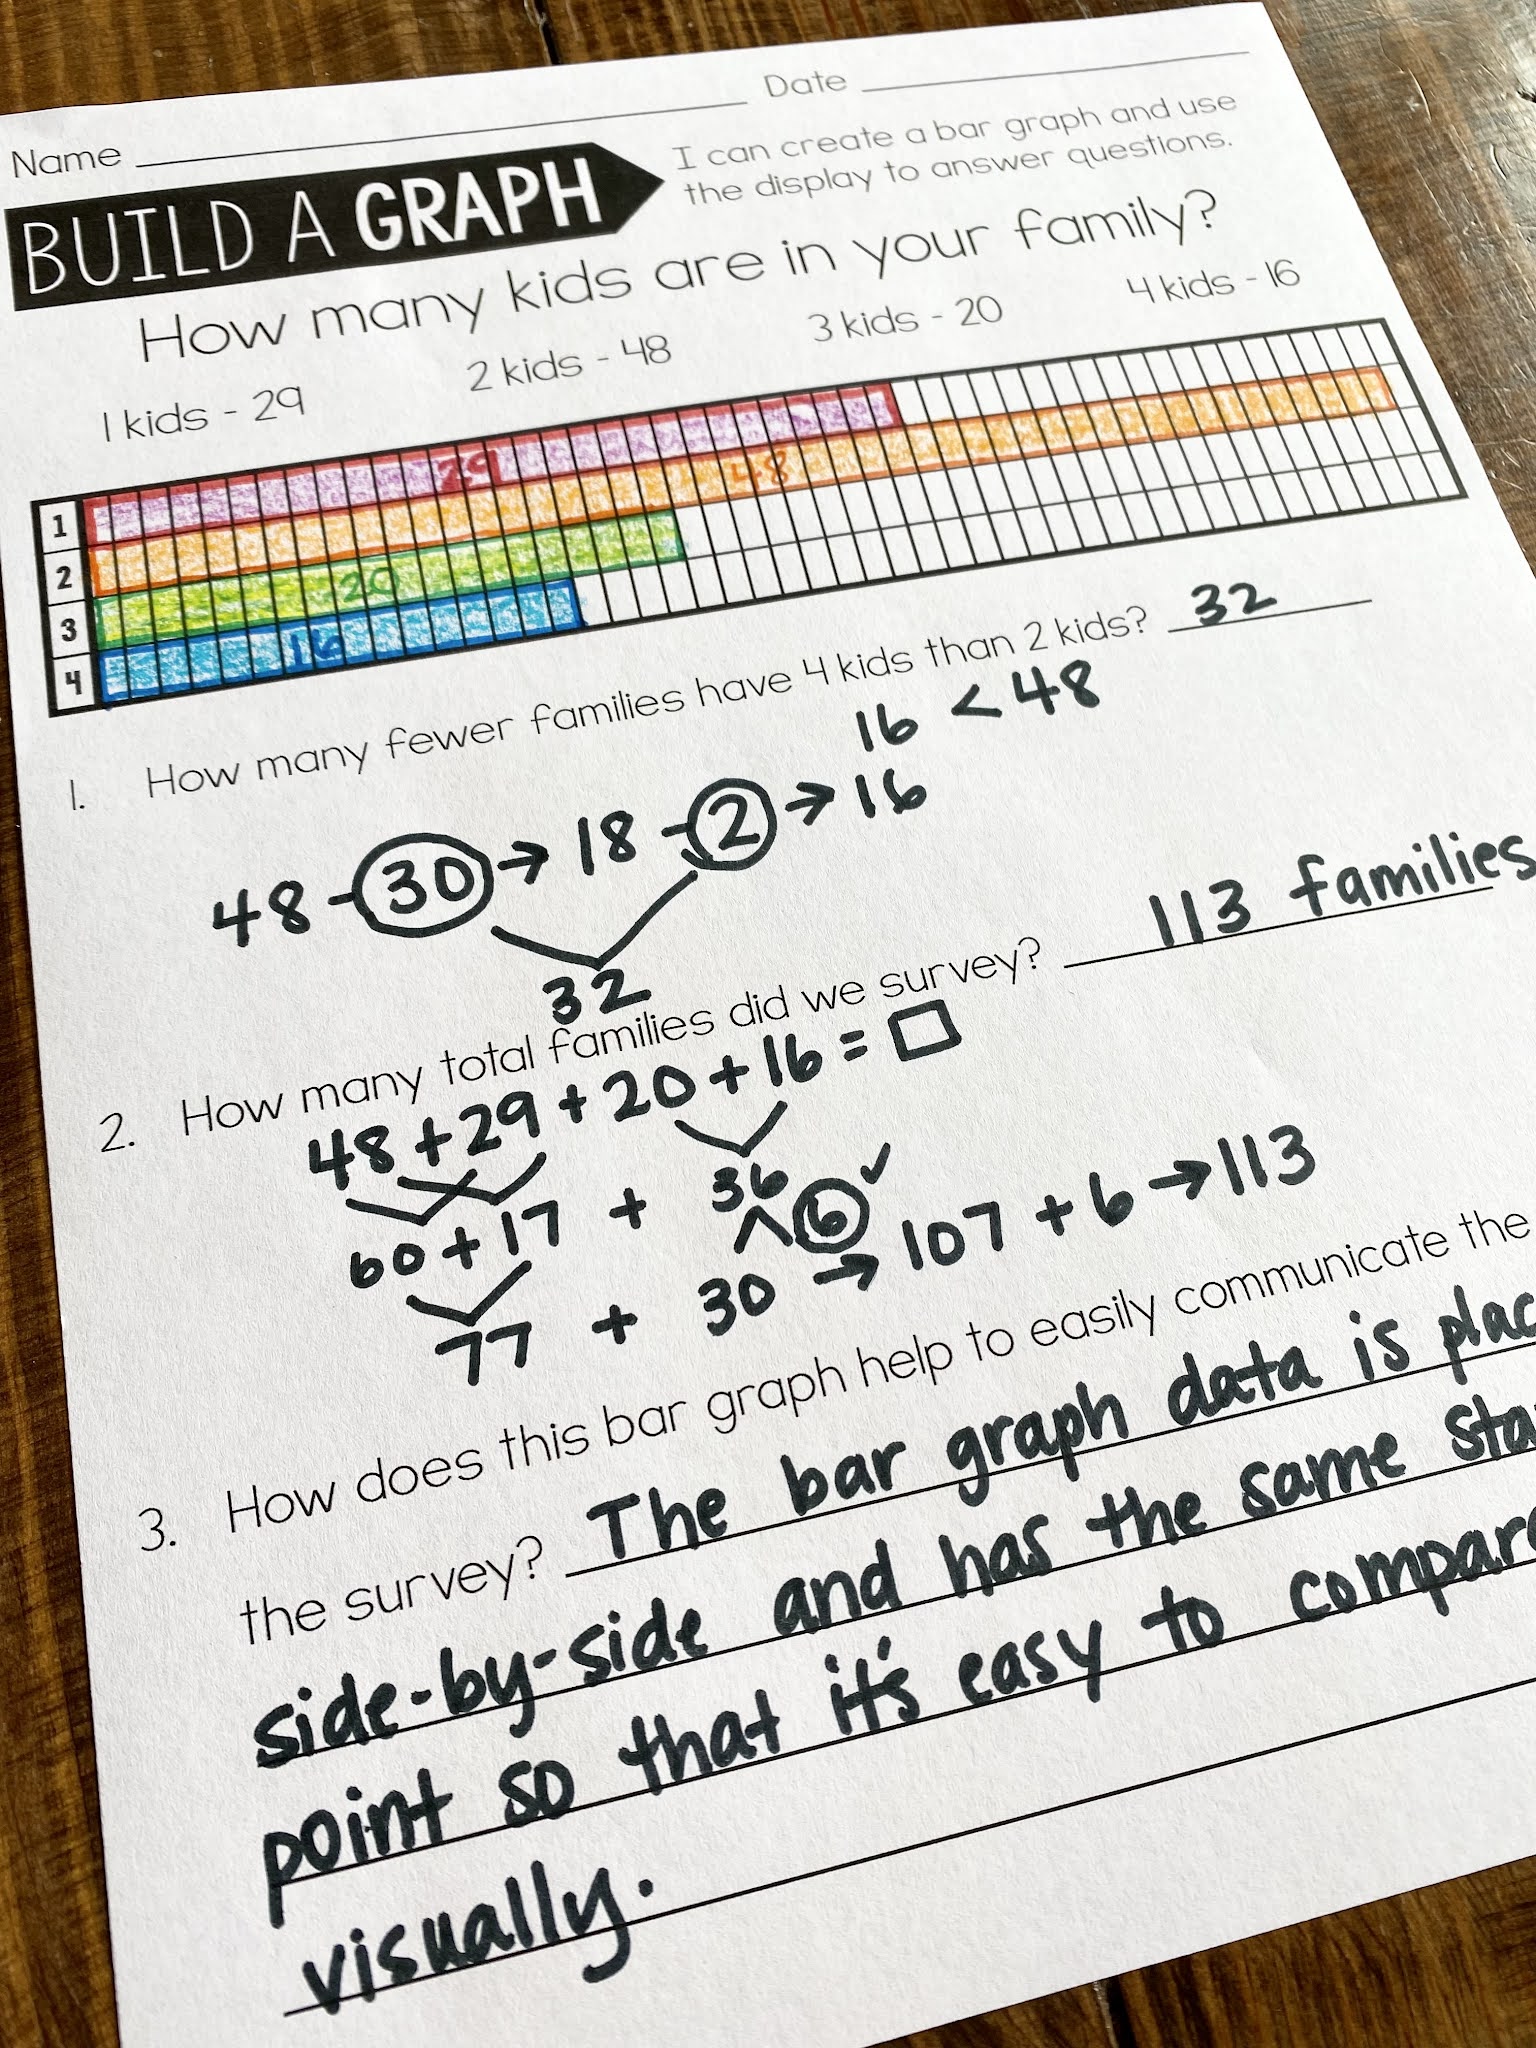
And in 2nd grade guided math last year, our comparisons got a little more in depth. By 2nd grade, I am looking for any and all opportunities to notate our thinking. And when we are comparing data, we are adding and subtracting–and that means it’s a GREAT time to talk about communicating how we got our answers with our math notation.
Analyzing Data for Kids with a range of data displays
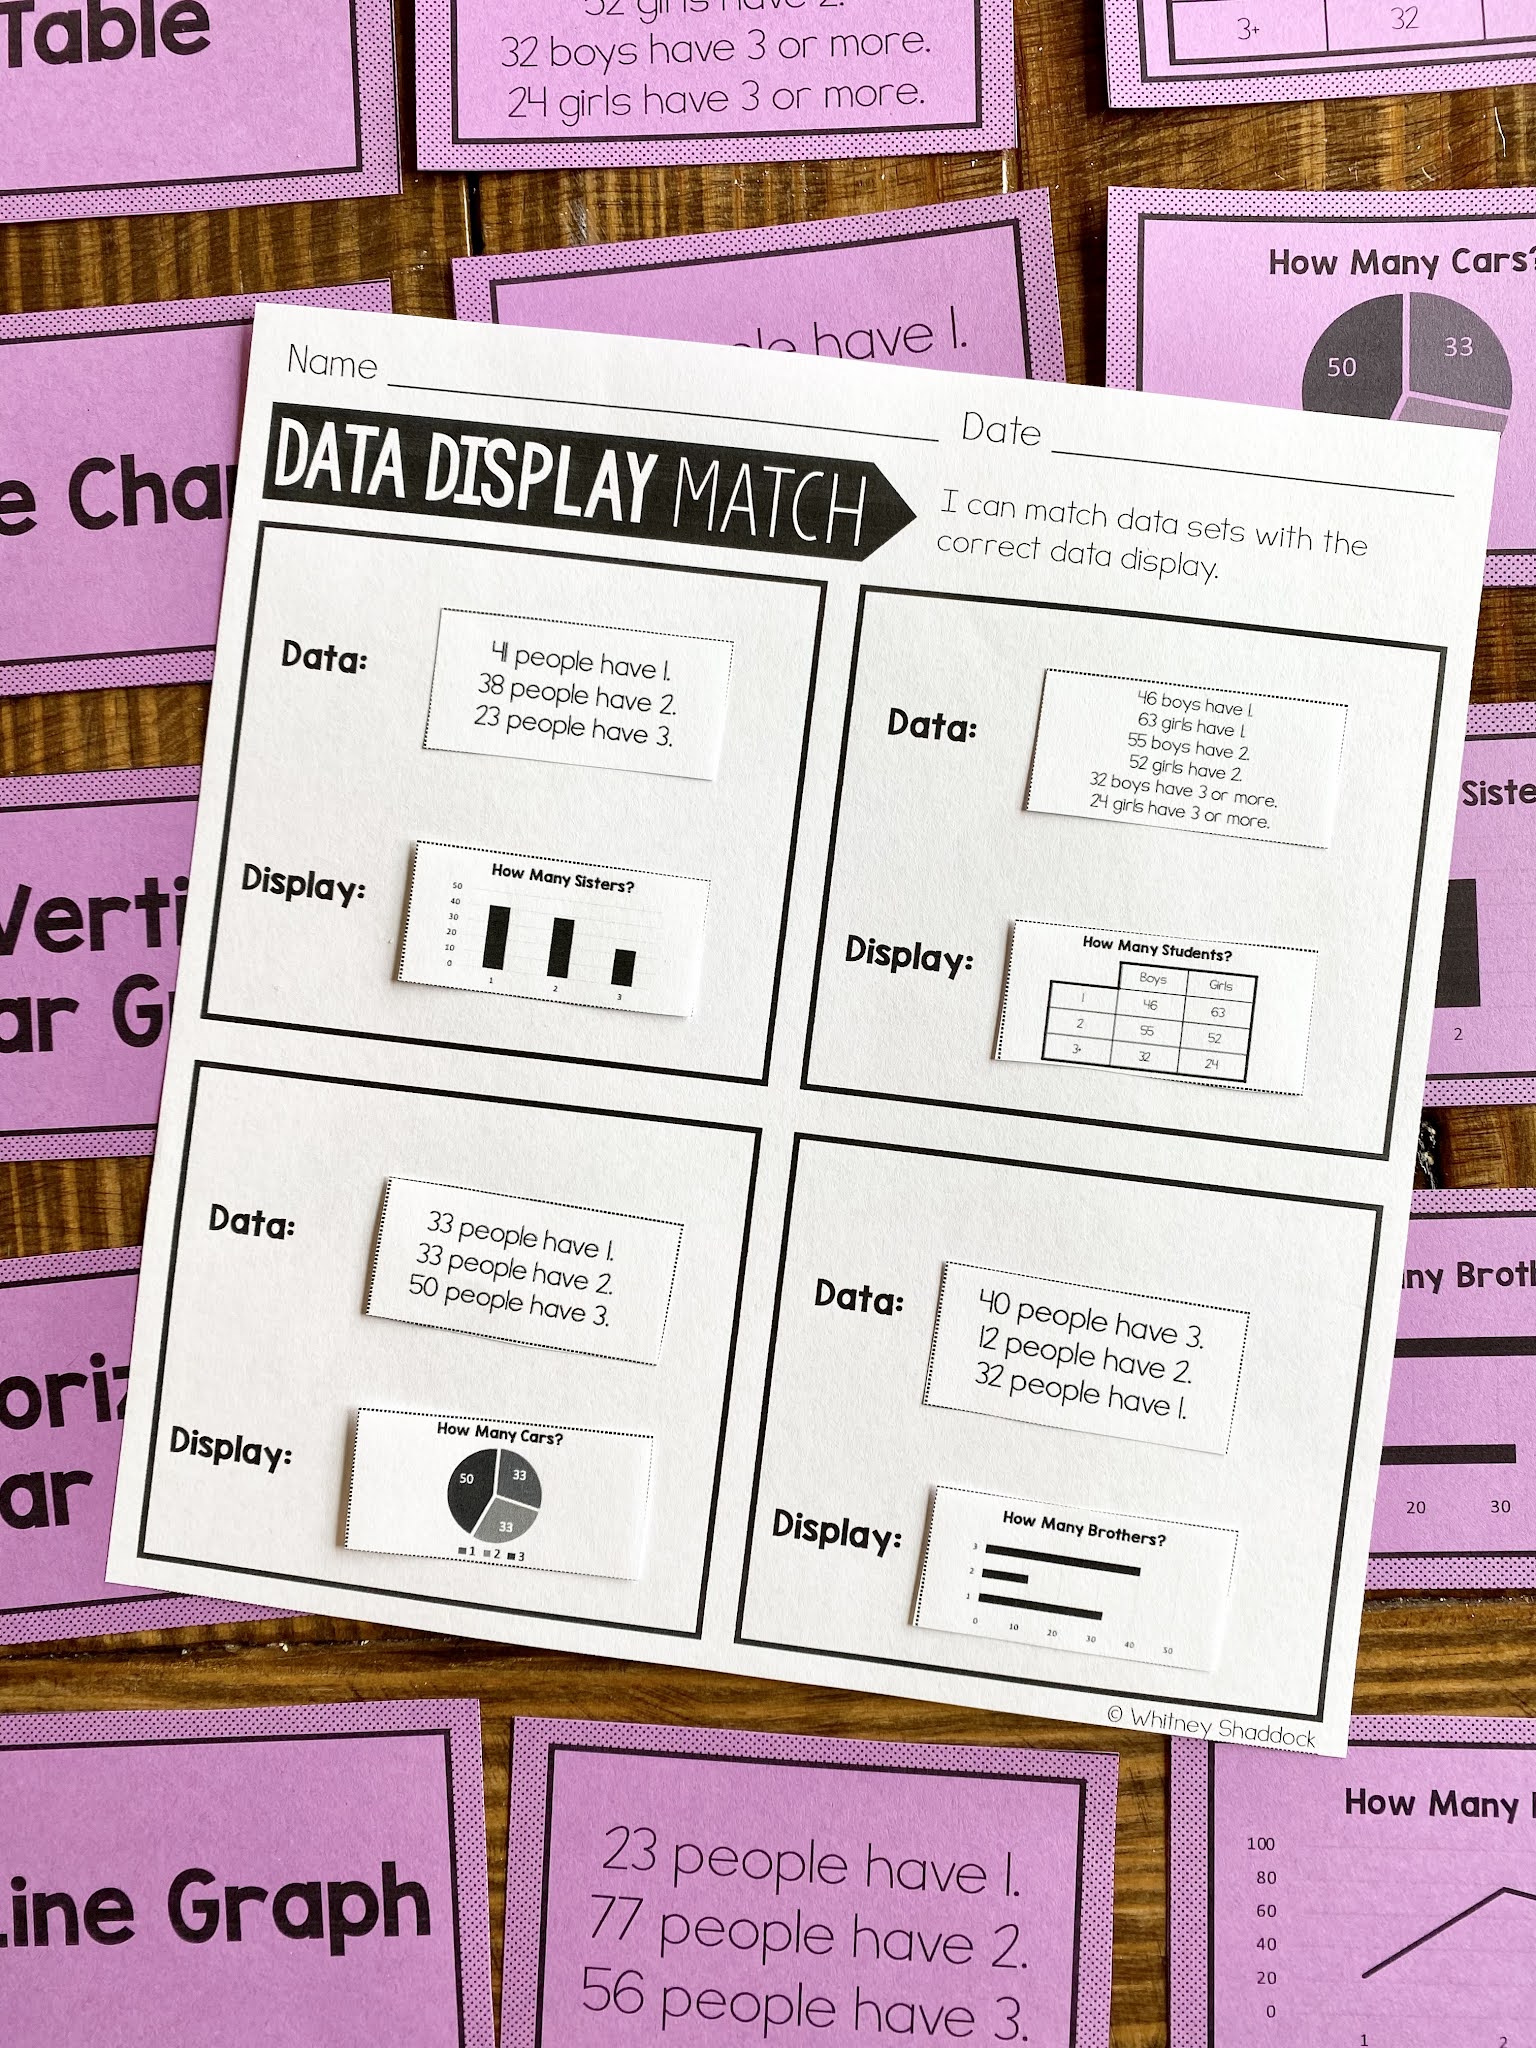
Once kids have been exposed to “filling in” a variety of data display types, it’s time to really focus on analyzing each display type. We talk about how to recognize a pie chart versus a bar graph. We talk about when it would be best to use tallies and when it would be better to use a table or bar graph.
One of the first things we do when focusing on data displays is sort them together.
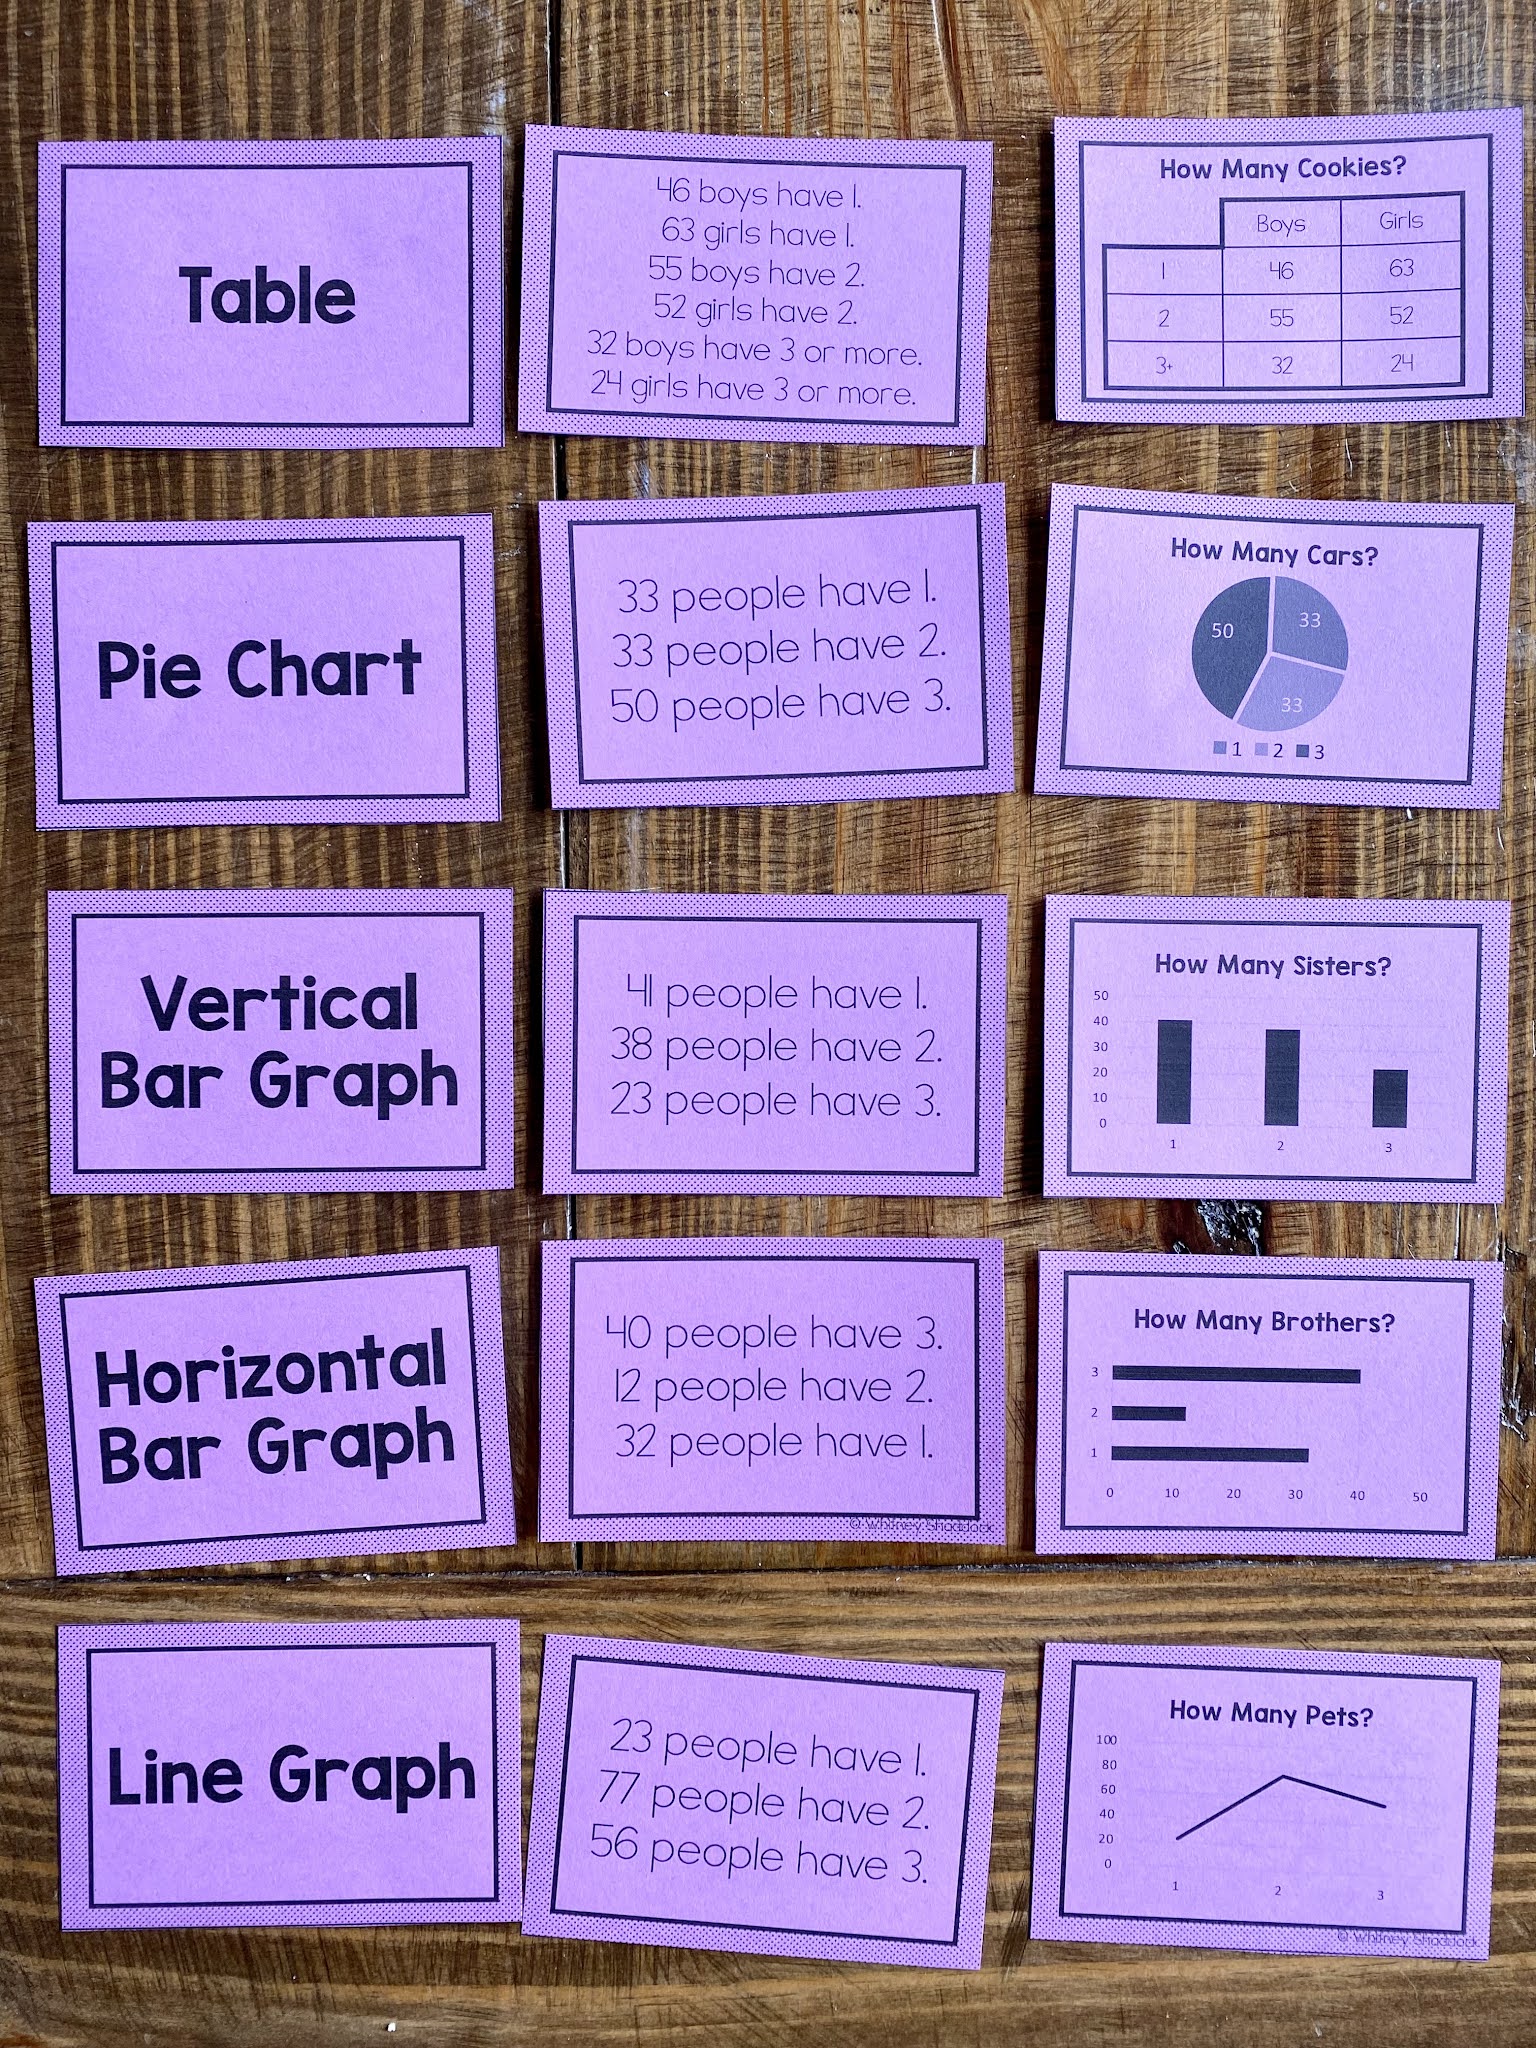
Then, the kids have a chance to match data displays independently during our guided math hands-on time.
Analyzing data for kids really can be as easy as those 5 Cs: Create, collect, count, compare, and communicate.
And you can find these graphing activities to help with all of that in my 2nd grade Guided Math Plans and additional, seasonally themed graphing printables here.